


Antarctic sea ice reached the third-lowest annual maximum in the satellite observation record in 2026, as reported in the NASA Earth Observatory overview published this Monday, October 12. Estimated extent reached 17.59 million square kilometers on September 14. The result describes the highest point of that year’s expansion cycle, not a measurement of the volume of all ice on the continent.
The news may sound contradictory: how can ice grow while recording a low maximum? The answer lies in the comparison. Expansion during winter is one thing; comparing the size of that expansion with the maxima of other years is another. To understand the figure without mixing indicators, we have brought together five points about what was measured, how to read the ranking and which conclusions it supports.
1. The sea ice maximum is a stage in the cycle
Antarctica is a continent surrounded by ocean. During the southern winter, sea ice expands over part of those waters; as the season changes, the cover retreats. The peak usually occurs around September, while the smallest extent generally arrives in February. Reaching an annual maximum therefore does not necessarily mean exceeding the historical average. It simply means reaching the highest value within that growth cycle.
Think of two separate comparisons. The first follows the curve within one year, tracking its rise to the peak and subsequent fall. The second places the peaks of several years side by side. The 2026 result belongs to the second comparison when described as third-lowest. Switching between them creates misleading headlines, whether claiming a complete recovery or saying there was no expansion during winter.
2. Sea ice extent is not the same as volume
NSIDC, a research center at the University of Colorado Boulder, explains that extent and area are different indicators. Extent calculations include entire grid cells with at least 15% ice cover. Area calculations also take into account the proportion actually occupied by ice within the included cells. The results can therefore differ even when they use the same observations.
A teaching example helps: imagine a one-square-kilometer cell with half its surface covered by ice. It would add one square kilometer to extent, but only half a square kilometer to area. This illustrates the method; it does not represent an actual cell used in this story. Volume would also require information about thickness. It is therefore incorrect to convert 17.59 million square kilometers into tons of ice or an average thickness without additional data.
3. How to interpret the 2026 ranking
NSIDC’s September 23 statement already identified September 14 as the likely date of the Antarctic maximum, with the same value of 17.59 million square kilometers. At that point, the institution treated the identification as preliminary, explaining that fluctuations around the peak make it difficult to settle the date immediately. The Earth Observatory overview published today presents the result as the third-lowest maximum in the record.
The distinction between the observation date and publication date matters. The peak occurred in September; the explanatory article was published in October. A headline saying sea ice reached that value today would confuse the two moments. The word maximum must also remain in the comparison. The third-lowest maximum is not the third-smallest extent on any day in history, because summer minima belong to another part of the cycle.
4. What satellites can track
Sea ice observations use passive microwave sensors that detect energy naturally emitted by the surface. This range allows monitoring of polar regions even through clouds and during winter darkness. The method provides a sequence of measurements that can be compared over time. It is not simply a matter of counting white blocks in ordinary photographs taken on clear days.
That does not remove limitations. Sensor resolution and conditions such as meltwater on ice affect the interpretation of concentration, as NSIDC’s technical material explains. Reading the methodology helps explain why a threshold is used and why institutions may report different area and extent figures. When you encounter two values, first compare the variable, region and date. A difference does not automatically prove that one measurement is wrong.
5. Read sea ice within the historical record
An annual result should be interpreted alongside the observation sequence, not as a replacement for it. NSIDC’s statement places the 2026 Antarctic growth season in a context of below-average coverage. At the same time, a single maximum is insufficient to attribute all of that year’s physical causes. Separating the observed result from explanations of its causes prevents an important indicator from becoming an answer to every climate question.
To check future stories, look for four details together: which pole was observed, which indicator was used, the measurement date and the reference period for the comparison. Do not directly compare an Arctic minimum with an Antarctic maximum as if they were the same event. The hemispheres experience opposite seasons, and their geography also differs. Context is part of the information, not an optional detail in a caption.
How to follow the next updates
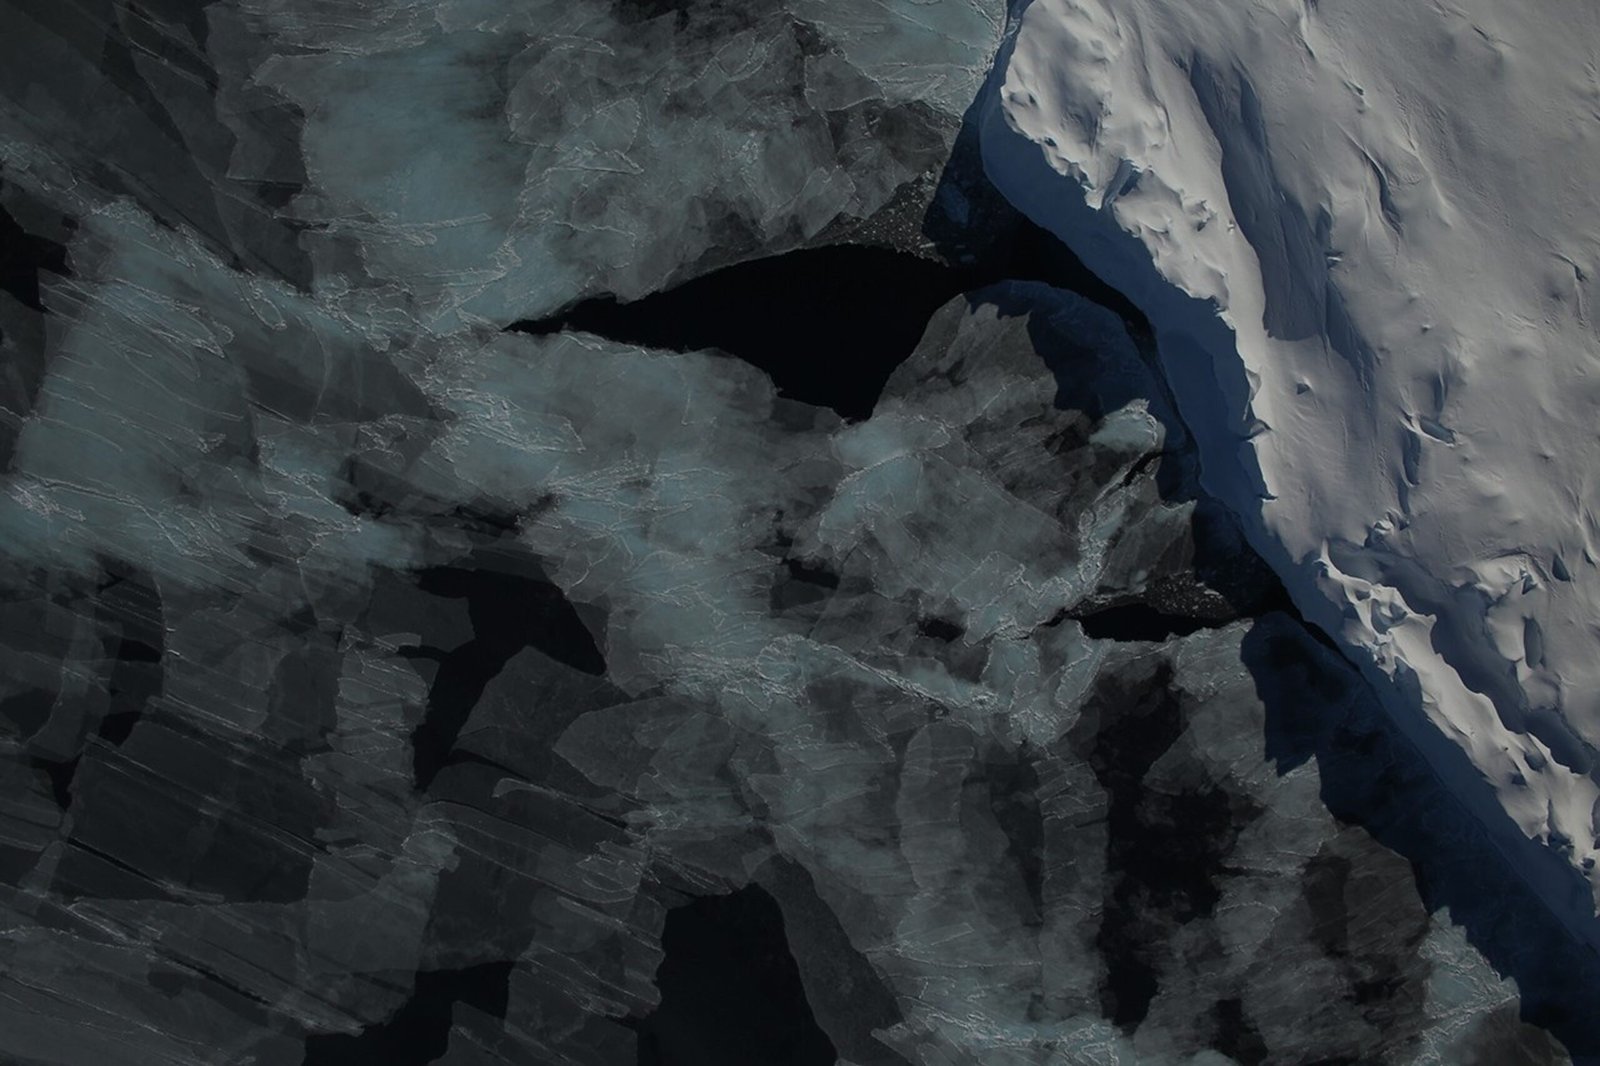
Save the bulletin links and check whether revisions retain or change the value and ranking. When sharing the figure, preserve its unit and scope: annual maximum extent of Antarctic sea ice. This article’s opening photograph is an archive image from 2014 in the Bellingshausen Sea; it illustrates the environment and does not document the 2026 peak. To analyze this year’s result, consult the maps and methodology in the sources below.
This article was checked on October 12, 2026 using NASA and NSIDC publications. Its relevance is the overview released on this date, without a claim of measured search popularity. Values retain the units used by the sources, and the calculation example is identified as educational. Following these distinctions makes it possible to read a scientific update more precisely, rather than relying only on the impact of a headline.
Verified sources
NASA Earth Observatory: October 12 overview · NSIDC: September 23 statement · NSIDC: difference between area and extent · More world news

Lucas, a 25-year-old from São Paulo, has found a vibrant space for his passion for games and technology in the Roblox universe. Owner of a blog dedicated to the platform, he dedicates himself to exploring the various virtual worlds, sharing tips and news, and analyzing the technical aspects that make the Roblox experience so captivating. His ability to write engaging articles turns his passion into valuable content for other enthusiasts. Living in São Paulo, Lucas reconciles his life in the metropolis with the creation of online content, building a bridge between the digital world of games and the world of technology.